Analyzing Bandwidth and Latency on YUIBlog.com
 About the author: Philip Tellis (@bluesmoon) is a geek working with Yahoo!'s Exceptional Performance team where he analyses the impact of various design decisions on web application performance. He also maintains YUI's date formatter and the YUI port of the flot charting library. You can find him on the web at http://bluesmoon.info/.
A few months ago, Eric helped me run some analysis on the types of network connections that were coming in to YUIBlog. In this article, I'll analyze the data we collected and look for insights about the tools and infrastructure the YUIBlog readership uses to browse the web. Being the performance guy at Yahoo!, my interest focuses how fast our readers connections are. In particular, with what kind of network bandwidth and latency do YUI geeks experience the web? Although your mileage will vary, YUIBlog is likely to be representative of US tech blogs read by people in the software industry, and the data here may prove useful for those of you catering to a similar audience.
Caveats
Before I go any further, I have a few caveats to list. The tests and analysis we ran were based in the US (since that's where YUIBlog is hosted), so if you view this site from outside the US, your measured experience will probably be a little slower than what you'd see with local sites. Secondly, while we see traffic from all over the world, I'll only look at countries with a statistically relevant sample size. Lastly, each individual IP was considered only once. If the same IP accessed the site more than once, we consider the arithmetic mean of values from each access. For overall summaries, we use the median. No statistical filtering was applied to the data before analysis. The total sample size was approximately 27,000 points.
The tests
The test measured HTTP bandwidth and HTTP latency between an end user's computer (or a proxy somewhere in between) and YUIBlog. Note that I say HTTP bandwidth and latency because these may be different (i.e., worse) from the actual bandwidth that your ISP provides you, but it's what we, as frontend engineers, care about more. Latency is the time between a request going out and the first byte of the response coming back. It depends on how far you are from the server and the number and quality of hops between you and the server, so if you're far away, you'll have high latency. HTTP latency also depends on the overhead of HTTP headers, but we've tried to keep that down, and on how long it takes for the web server to respond to a request. We think that's fairly fast.
Bandwidth depends on the bandwidth at every step between you and the server, and it's somewhat affected by latency as well. The measured bandwidth is also affected by other applications or devices using the network in parallel. If you're streaming movies or loading an image heavy site while a measurement is taken, your bandwidth will appear lower than it actually is. However, this is the effective bandwidth that you browse YUIBlog with, so it's what we care about.
So, what kind of networks do YUI geeks browse through?
Quick summary answer: The bandwidth of YUI geeks is 1 Mbps (that's Megabits) and the latency is 262 ms. Most of you are either on Broadband, DSL or Cable connections and come in from the US, Canada, Great Britain, Germany and India (ordered by distance from our server). For more detailed results, read on...
Connection types
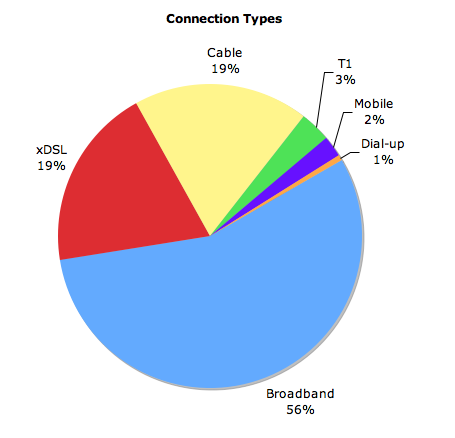
The type of network connection you have with your ISP determines the primary bandwidth limit and secondary latency limit (the first being distance divided by the 66% speed of light). Not surprisingly most of you are very closely associated with the internet, and use Broadband data connections. Only 2% of you used your mobile phones to reach the site, but that's still more than the number of people on dial-up.
| Connection Type | Broadband | xDSL | Cable | T1 | Mobile | Dial-up | Wireless | Satellite |
|---|---|---|---|---|---|---|---|---|
| Count | 14155 | 4874 | 4719 | 880 | 552 | 143 | 86 | 71 |
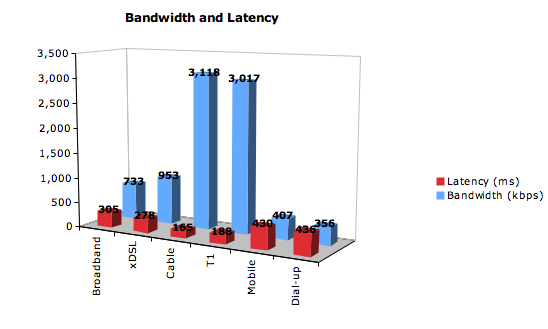
| Bandwidth (kbps) | 733 | 953 | 3,118 | 3,017 | 407 | 356 | 291 | 287 |
| Latency (ms) | 305 | 278 | 165 | 188 | 430 | 436 | 537 | 859 |
Of all the connection types we've seen, Cable and T1 offer the best bandwidth and latency, going over four times as fast as Broadband with half the latency. This could possibly mean that most of these connections were within the US while the others span the globe. The low latency seems to suggest that, but drilling down reduces the sample size too much to make an accurate assessment. From the data we see a clear inverse relationship between bandwidth and latency.
International data
We expected connections from outside the US to appear slower because the test has an intrinsic geographical bias, but what does the data really tell us?
| Countries | CA | US | DK | NL | NO | BE | SE | CH | AT | GB | FI | DE | CZ | FR | RO | PT | BG | HU | ES | IT | PL | GR | JP | UA | AR | TR | KR | RU | BR | TW | HK | AU | SG | IN | PH | TH | CN | ID |
|---|---|---|---|---|---|---|---|---|---|---|---|---|---|---|---|---|---|---|---|---|---|---|---|---|---|---|---|---|---|---|---|---|---|---|---|---|---|---|
| Numrecs | 949 | 9071 | 141 | 497 | 238 | 218 | 417 | 212 | 181 | 1833 | 157 | 1503 | 176 | 811 | 232 | 168 | 129 | 151 | 455 | 496 | 405 | 126 | 340 | 251 | 179 | 224 | 154 | 395 | 482 | 174 | 133 | 659 | 146 | 1748 | 200 | 147 | 639 | 206 |
| Bandwidth (kbps) | 3,295 | 3,206 | 2,404 | 2,247 | 2,144 | 1,981 | 1,936 | 1,807 | 1,658 | 1,648 | 1,599 | 1,581 | 1,453 | 1,420 | 1,357 | 1,296 | 1,267 | 1,165 | 893 | 869 | 765 | 560 | 549 | 545 | 498 | 496 | 478 | 477 | 418 | 409 | 405 | 392 | 368 | 238 | 207 | 205 | 181 | 64 |
| Latency (ms) | 108 | 133 | 247 | 230 | 263 | 233 | 264 | 256 | 278 | 242 | 276 | 269 | 256 | 254 | 274 | 297 | 285 | 270 | 335 | 309 | 284 | 363 | 416 | 340 | 387 | 353 | 462 | 359 | 409 | 506 | 516 | 555 | 595 | 588 | 595 | 688 | 649 | 867 |
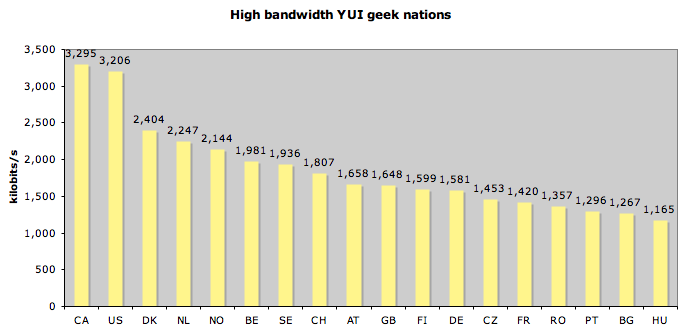
The US and Canada top the list as expected. All other countries with a bandwidth over 1 Mbps are from Europe. Looking at the other end of the spectrum, we see a few surprises.
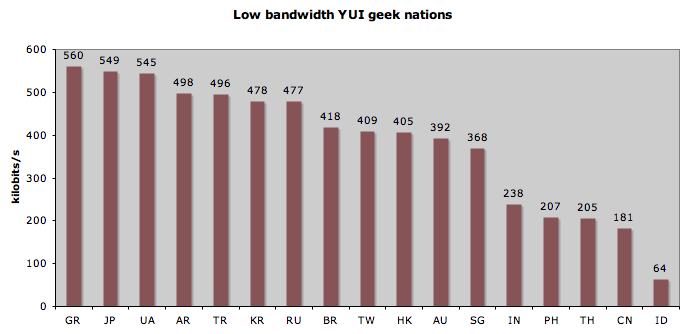
I know from recent experience that Korea and Hong Kong have really high bandwidth network connections. Faster than most of the US in fact. The data puts them at less than one sixth the bandwidth of the US. A possible explanation is the latency. As we already know, there's a correlation between bandwidth and latency. Looking at the latency numbers for these countries gives us a possible answer.
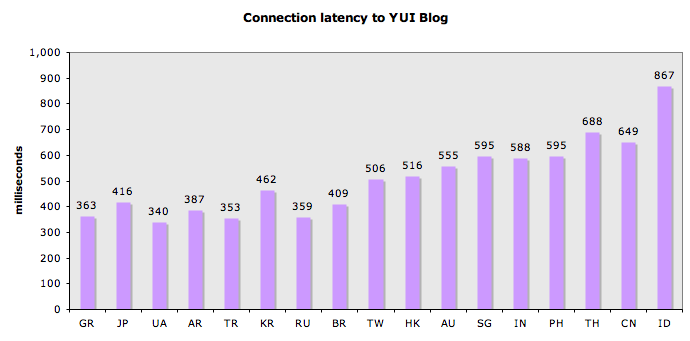
We get hits from many more countries (147 in all). They either fell between these two blocks or had too few data points to be a statistically sound sample.
ISPs
As the final piece of analysis, I looked at ISP information. I only looked at a few countries since there were too many ISPs world-wide to put on a bar chart. Presented in the chart below is data for US and Canadian ISPs.
| Country | ISP | Latency (ms) | Bandwidth (kbps) |
|---|---|---|---|
| Germany | hansenet telekommunikation gmbh | 282 | 1,849 |
| international ip-backbone of vodafone | 263 | 1,282 | |
| deutsche telekom ag | 311 | 1,149 | |
| Great Britain | avatar broadband limited | 229 | 2,200 |
| btnet uk regional network | 256 | 1,769 | |
| ntl group limited | 253 | 1,581 | |
| India | videsh sanchar nigam ltd. aut | 508 | 355 |
| reliance infocom ltd internet | 615 | 260 | |
| bharti airtel ltd. telemedia services | 601 | 226 | |
| tata communications | 569 | 195 | |
| national internet backbone | 609 | 167 | |
| USA | cablevision systems corp. | 78 | 4,752 |
| verizon global networks | 101 | 4,218 | |
| road runner holdco llc | 108 | 4,093 | |
| charter communications | 114 | 3,945 | |
| comcast cable communications inc. | 123 | 3,816 | |
| att worldnet services | 117 | 3,328 | |
| time warner telecom | 95 | 3,304 | |
| cox communications inc. | 166 | 3,224 | |
| xo communications | 140 | 2,986 | |
| qwest | 203 | 1,892 | |
| att internet services | 204 | 1,502 | |
| bellsouth.net inc. | 121 | 1,446 | |
| Canada | rogers cable communications inc. | 96 | 4,386 |
| bell canada | 103 | 3,161 | |
| shaw communications inc. | 203 | 3,007 |
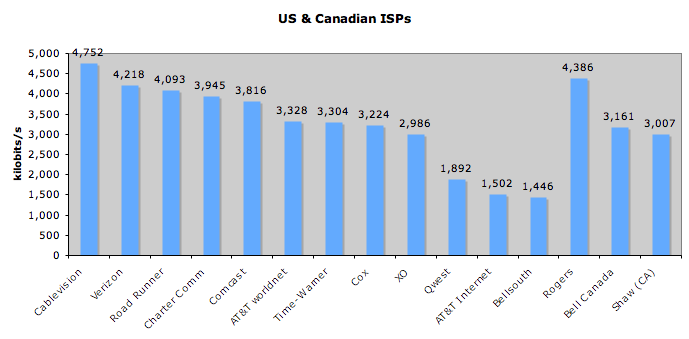
I'm not sure what the difference between AT&T Worldnet and AT&T Internet is, but I'll leave that for you to figure out. We saw more hits from Comcast than from any other ISP on the planet.
Users of different browsers
The browser you use doesn't affect your bandwidth (at least hasn't in lab tests) and has a very negligible effect on latency, so I didn't expect to see any differences here. I was curious though, to see what the data said, and this is what I found. I've included iPhones and iPods as well as they made up a sizeable fraction of all data points. Opera's mobile browsers are included under Opera. The "other" category only included 22 data points.
| Browser | Latency | Bandwidth |
|---|---|---|
| Gecko | 267 | 1,105 |
| Webkit | 238 | 1,591 |
| MSIE | 285 | 759 |
| Opera | 271 | 1,174 |
| iPod/iPhone | 399 | 477 |
| other | 274 | 1,289 |
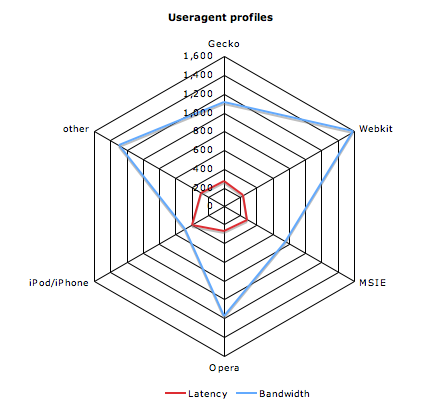
The iPhone's latency is close to other mobile phones. All other browsers have the same latency. This is as expected. Bandwidth tells a different story though. It appears that those of you with the fastest internet connections use a Webkit based browser like Safari, Chrome or Konqueror, while users with the slowest internet connections use Internet Explorer.
Summary
- The overall bandwidth of YUIBlog readers is 1 Mbps and the overall latency is 262ms
- We see a definite correlation between latency and bandwidth, so it would be interesting to see what the measured bandwidth is after eliminating delays caused by latency. Perhaps in a future test I'll do that.
- Putting a mirror in Asia probably makes sense for a US-based engineering blog like this one. Putting one in Europe probably doesn't.
- Mobile users have terrible latency, so a site optimised for mobile should really reduce the number of HTTP requests it makes. Note that mobile users that surf the web over wifi experience far lower latency.